Protective Action Decision-Making in Wildfires
Tom Cova, Frank Drews, Laura Siebeneck, Adrian Musters, Stuart Moffatt
Emergency managers recommend protective actions in the face of many threats to minimize loss of life and property and to maximize use of limited resources. In the context of wildfire, two common recommendations are to evacuate or shelter those at risk. Given these two options, questions arise as to which protective-action is best in a given scenario and when it should be issued. This project will examine: 1) the factors that are important in determining which protective action is best in a given wildfire, 2) the strategies that decision makers use to combine the factors, and 3) the effect of uncertainty on the decision making process. The research is based on a three-step experimental approach that relies on interviews, static information boards, and an interactive wildfire simulator to elicit knowledge from both expert and novice decision makers in wildfire management. Causal models of the decision making process will be developed and tested that include the relevant factors and their importance, the method by which they are combined, and the effect of uncertainty. The results of this research will advance protective-action decision theory and provide a basis for improving the quality of decision-making in emergencies.
Funding Source: National Science Foundation
Publications: Cova, T.J., Drews, F.A., Siebeneck, L.K. and Musters, A. (in press) Protective actions in wildfires: evacuate or shelter-in-place? Natural Hazards Review.

Mice from Space: Predicting Hantavirus Outbreaks with Satellite Imagery
Lina Cao, Tom Cova, Phil Dennison and Denise Dearing
Sin Nombre virus (SNV), a strain of hantavirus, causes hantavirus pulmonary syndrome (HPS) in humans, a deadly disease with high mortality rate. The primary virus host is deer mice, and greater deer mice abundance has been shown to increase the human risk of HPS. The focus of this project is identifying and comparing vegetation indices and associated time lags for predicting hantavirus risk using remotely sensed imagery. A five year time-series of Moderate-resolution Imaging Spectroradiometer (MODIS) satellite imagery and corresponding field data was utilized to compare various vegetation indices that measure productivity with the goal of indirectly estimating mice abundance and SNV prevalence. Relationships between the vegetation indices and deer mouse density, SNV prevalence, and the number of infected deer mice at various time lags were examined to assess which indices and associated time lags might be valuable in predicting SNV outbreaks.

Return-Entry Following Disasters: Getting Home
Laura Siebeneck and Tom Cova
Return-entry is the process of getting people home following an evacuation, and the focus of this research is the geographic, communication, and demographic factors that affect compliance with return-entry orders. In 2005, 2.5 million people evacuated from the Houston Metro area, and a three-day staged return-entry plan was developed to get them home. A survey of 1,200 evacuated households revealed that compliance with the return plan was low, as 46.4% of respondents returned home on or after their scheduled return date. Compliance with the return orders varied geographically in that evacuees who returned to areas damaged by the storm were more likely to comply with return orders than evacuees returning to undamaged areas. In addition, communication of the return-entry plan was relatively poor as 54.0% of evacuees reported receiving the all-clear message. A second study on the 2008 Cedar Rapids, Iowa Flood recently examined how risk perception and risk communication influence behavior during the evacuation and return-entry process. Preliminary analysis shows that risk perception varies geographically in that evacuees returning to areas impacted by the flood indicated a higher perception of risk associated with returning than evacuees returning to undamaged homes.
Publications: Siebeneck, L.K. and Cova, T.J. (2008) An Assessment of the Return-Entry Process for Hurricane Rita-2005. International Journal of Mass Emergencies and Disasters. 26 (2).
Siebeneck, L.K. and Cova, T.J. Risk Perception Associated with the Evacuation and Return-entry Process of the Cedar Rapids, Iowa Flood. Quick Response Report submitted to the Natural Hazards Center, Boulder, Colorado. Submitted September, 2008.

Visualizing Diurnal Population Change for Emergency Management
Tetsuo Kobayashi, Richard Medina, Tom Cova
While Census data provides a good estimate of the nighttime population distribution in an urban area, they can be a poor estimate of where people are throughout the diurnal (daily) cycle. The focus of this research is developing a methodology for visualizing and analyzing diurnal population change for metropolitan areas based on widely available U.S. Department of Transportation survey data. Pycnophylactic (volume preserving) interpolation within a GIS is used to create twenty-four (1 per hour) population surfaces for the larger metropolitan area of Salt Lake County, Utah. The resulting surfaces are representative of diurnal population change for an average work day and are ultimately combined to produce an animation that displays population dynamics throughout an average work day. This methodology can be used to address a number of emergency management problems.
Publications: Kobayashi, T., Medina, R.M., and Cova, T.J. (Under review) Visualizing Diurnal Population Change in Urban Areas for Emergency Management.
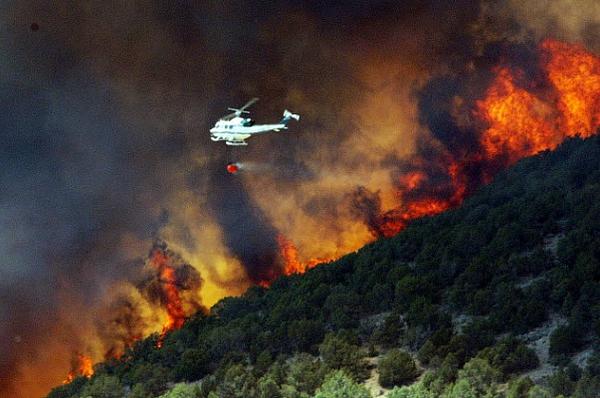
Developing New Codes for Evacuation Egress in the Wildland-Urban Interface
Tom Cova
Residential development in fire-prone wildlands is a growing problem for land-use and emergency planners. In many areas housing is increasing without commensurate improvement in the primary road network. This compromises public safety, as minimum evacuation times are climbing in tandem with vegetation and structural fuels. Current evacuation codes for fire-prone communities require a minimum number of exits regardless of the number of households. This is not as sophisticated as building egress codes which link the maximum occupancy in an enclosed space with the required number, capacity and arrangement of exits. This paper applies concepts from building codes to fire-prone areas to highlight limitations in existing community egress systems. Preliminary recommendations for improved community evacuation codes are also presented.
Publications:Cova, T.J. (2005) Public safety in the urban-wildland interface: should fire-prone communities have a maximum occupancy? Natural Hazards Review, 6(3): 99-108.

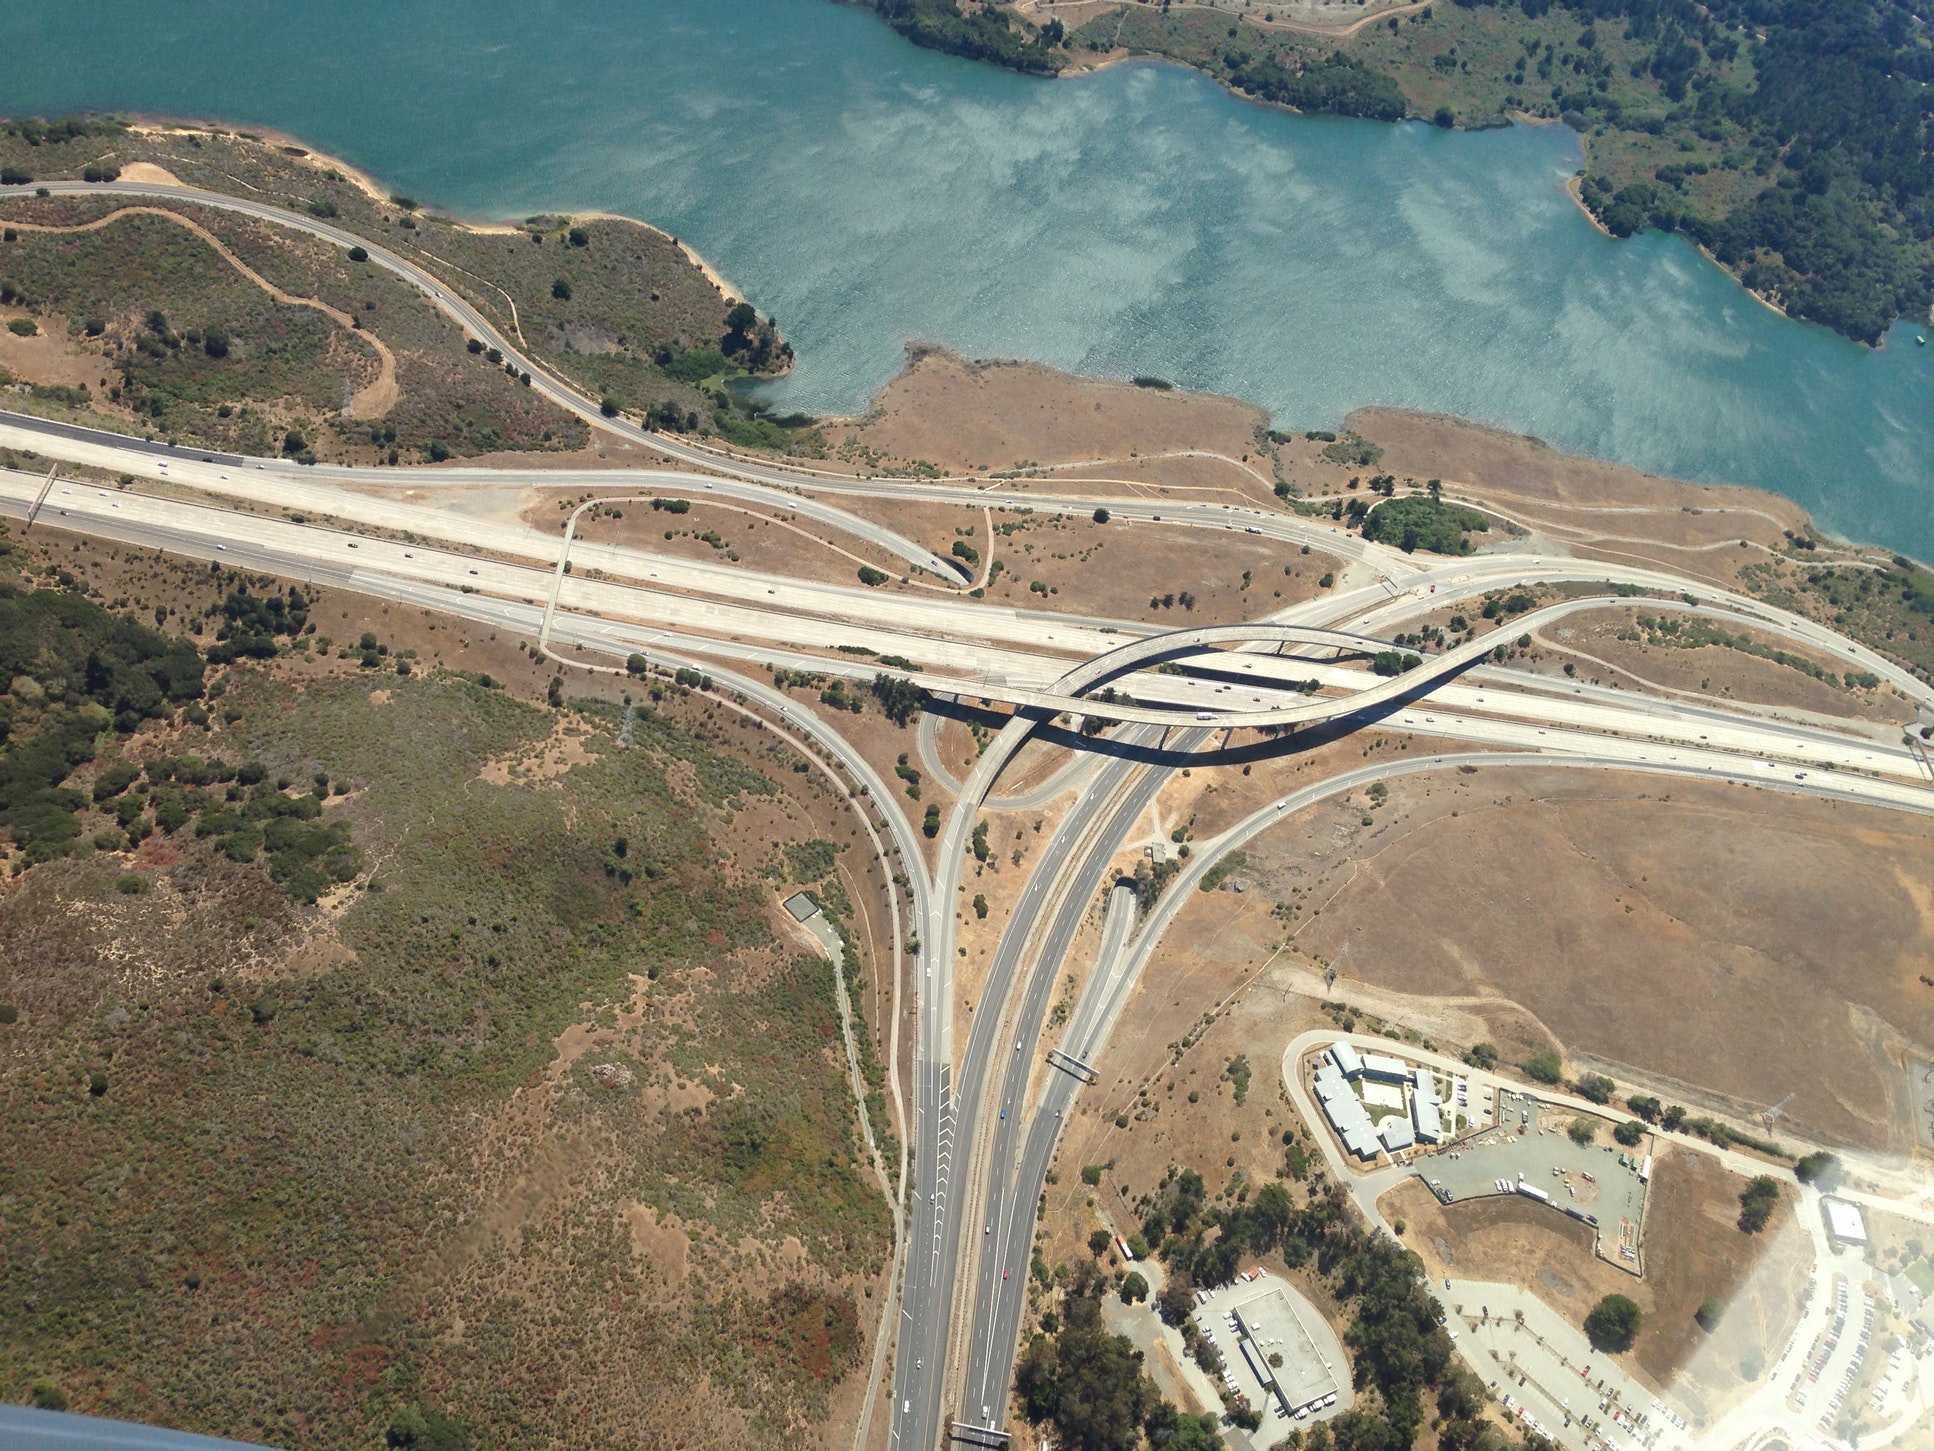
Optimal Lane-Based Evacuation Routing
Tom Cova and Justin Johnson
Most traffic delays in regional evacuations occur at intersections. Lane-based routing is one strategy for reducing these delays. The focus of this research is developing a network flow model for identifying optimal lane-based evacuation routing plans in a complex road network. The model is an integer extension of the minimum-cost flow problem. It can be used to generate routing plans that trade total vehicle travel-distance against merging, while preventing traffic crossing-conflicts at intersections. A mixed-integer programming solver is used to derive optimal routing plans for a sample network. Manual capacity analysis and microscopic traffic simulation are used to compare the relative efficiency of the plans. An application is presented for Salt Lake City, Utah.
Publications: Cova, T.J., and Johnson, J.P. (2003) A network flow model for lane-based evacuation
routing. Transportation Research Part A: Policy and Practice, 37(7): 579-604

Remote Sensing Retrieval of Live Fuel Moisture
Phil Dennison, Kraivut Charoensiri
Moisture contained within both live and dead fuels must be driven off before the fuels can be burned by fire. Live fuel moisture is an important indicator of wildfire danger in shrubland fuels, including chaparral in California and sagebrush in Utah. This project is studying the use of remote sensing data for retrieving shrubland live fuel moisture. As live fuel moisture in shrubs decreases, chlorophyll absorption in the visible region of the spectrum and water absorption in the shortwave infrared region of the spectrum also decrease. These changes in spectral response can be linked to the decline in live fuel moisture over time. Research has demonstrated strong links between measures calculated from Moderate Resolution Imaging S pectrometer (MODIS) data and live fuel moisture in southern California chaparral.
Publications: Dennison, P.E., M.A. Moritz, and R.S. Taylor, 2007. Examining Predictive Models of Chamise Critical Live Fuel Moisture in the Santa Monica Mountains, California. International Journal of Wildland Fire, in press.
Dennison, P.E., D.A. Roberts, and S.H. Peterson, 2007. Spectral shape-based temporal compositing algorithms for MODIS surface reflectance data. Remote Sensing of Environment, in press. Abstract Preprint
Roberts, D.A., P.E. Dennison, S. Peterson, S. Sweeney, and J. Rechel, 2006. Evaluation of AVIRIS and MODIS measures of live fuel moisture and fuel condition in a shrubland ecosystem in southern California. Journal of Geophysical Research Biogeosciences, 111, G04S02. Article
Dennison, P.E., D.A. Roberts, S.H. Peterson and J. Rechel, 2005. Use of normalized difference water index for monitoring live fuel moisture. International Journal of Remote Sensing, 26, 1035-1042. Abstract
Dennison, P.E., D.A. Roberts, S.R. Thorgusen, J.C. Regelbrugge, D. Weise and C. Lee., 2003. Modeling seasonal changes in live fuel moisture and equivalent water thickness using a cumulative water balance index. Remote Sensing of Environment, 88, 442-452. Abstract Preprint

Terrorism in Space and Time
Terrorist incidents are not random in space or time. Understanding the current spatial and temporal patterns of terrorist incidents, as well as predicting future trends, is vital for effective counter-terrorist efforts. This research focuses on terrorist incidents in Iraq, which are defined here as attacks, both successful and unsuccessful, in order to detect patterns in the establishment of terrorist activity spaces. Using Geographic Information Science (GISc), this project carries out a series of spatial and temporal cluster identification analyses on recent terrorist incidents in Iraq. Terrorism in the twenty-first century is decentralized, global, and capable of causing mass death and destruction. Social and geographic decentralization of these networks on a global level has created the most dangerous terrorist threat ever seen. Information technologies have designated any populated area as breeding grounds for homegrown terrorists. This geographic expansion is possible through the accessibility of ideology information, training materials, and radicalization assistance online for potential terrorists. These organizations are structured in dense networks that prevail partially because they are a subset of the much larger supportive community. An improved understanding of present day terrorist network structures, processes, and support communities will strengthen counter terrorism efforts and policy. This research analyzes Islamist terrorist networks as complex adaptive systems in geographic and social spaces.
Publications: Siebeneck, L. K., R. M. Medina, I. Yamada, and G. F. Hepner. (2009) Spatial and Temporal Analyses of Terrorist Incidents in Iraq, 2004-2006. Studies in Conflict and Terrorism.
Medina, R., and G. F. Hepner. (2008) Geospatial Analysis of Dynamic Terrorist Networks. In Values and Violence: Intangible Aspects of Terrorism, eds. I. Karawan, W. McCormack and S. E. Reynolds. Berlin: Springer.
Medina, R. (in progress) Use of Complexity Theory to Understand the Geographical Dynamics of Terrorist Networks, Ph.D. Dissertation, Department of Geography.
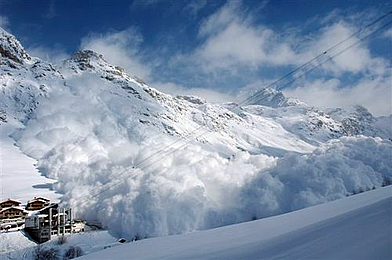
Avalanche Frequency and Power Laws
Adam Naisbitt, Richard Forster, Karl W. Birkeland, and William L. Harrison
Power-laws provide a means for investigating snow avalanche frequency-magnitude relationships and their contributing factors. This research uses power laws to explore variations in avalanche size proportions through space and time, as well as investigating factors which may contribute to these variations. Data utilized for this work includes the Westwide Avalanche Network data from the western United States for regional analyses, with path-specific analyses focused on data from Utah s Little Cottonwood Canyon. Results show power-law exponents vary through space both at the regional level and between individual avalanche paths. Avalanche size proportions, with respect to space, are the product of terrain based variables at both the mountain range and the path levels, with alpha angles significantly correlated to the proportion of small to large avalanches. This research also indicates that variation in exponents through time is indicative of changes in seasonal weather and snowpack characteristics, with mean snow height also significantly correlated to the proportion of small to large avalanches. Knowledge of power-law exponents for particular avalanche paths, and their relationship to seasonal snowpack depth, may be helpful for managing avalanches along highway corridors, in ski areas, or in backcountry forecasting operations.
Publications: Naisbitt, A., Forster, R.R., Birkeland, K.W., and Harrison, W.L. (2008) Avalanche frequency and magnitude: using power-law exponents to investigate snow avalanche size proportions through time and space
Family Gathering in Evacuations
Marquessa van Drimmelen and Tom Cova
The focus of this project is family gathering patterns and associated behavior in evacuations using a case study of the June 2007 Angora Fire in South Lake Tahoe. The fire burned more than 3,100 acres, destroying more than 250 homes and causing the evacuation of 3,000 residents. Prior research has found that family gathering is a necessary precursor to successfully evacuating a community, and there is a need to examine the geographic dimensions of this process more closely. Collecting data on this process will improve our understanding of the actual gathering patterns of families during an evacuation, as well as the effects that this process has on the transportation system.
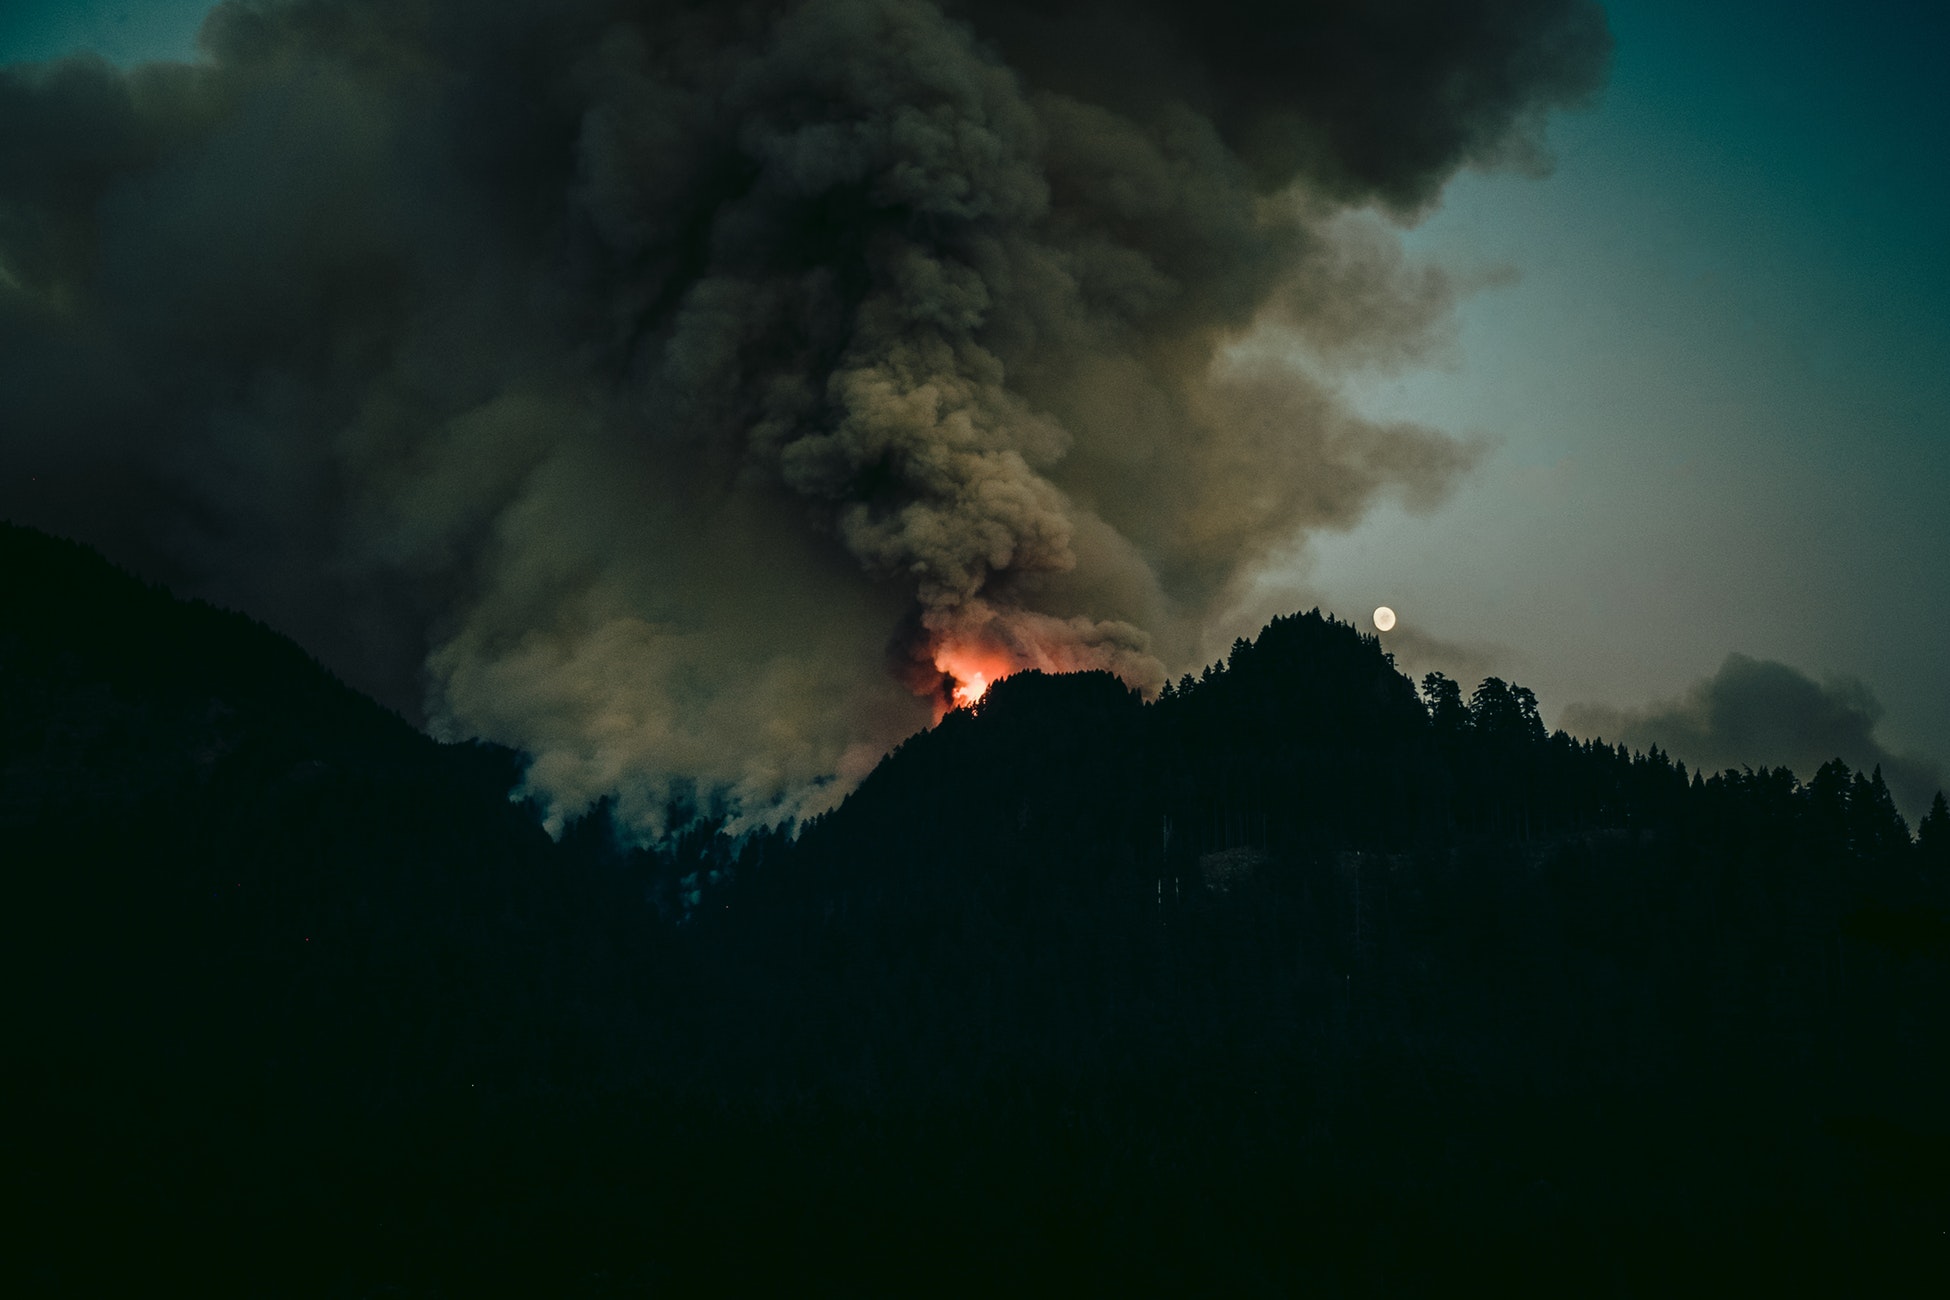 Mapping Wildfires and the Timing of Protective Actions
Tae Kim, Tom Cova and Andrea Brunelle
While Census data provides a good estimate of the nighttime population distribution in an urban area, they can be a poor estimate of where people are throughout the diurnal (daily) cycle. The focus of this research is developing a methodology for visualizing and analyzing diurnal population change for metropolitan areas based on widely available U.S. Department of Transportation survey data. Pycnophylactic (volume preserving) interpolation within a GIS is used to create twenty-four (1 per hour) population surfaces for the larger metropolitan area of Salt Lake County, Utah. The resulting surfaces are representative of diurnal population change for an average work day and are ultimately combined to produce an animation that displays population dynamics throughout an average work day. This methodology can be used to address a number of emergency management problems.
Publications: Kobayashi, T., Medina, R.M., and Cova, T.J. (Under review) Visualizing Diurnal Population Change in Urban Areas for Emergency Management.

Microsimulation of Neighborhood Evacuations
Tom Cova and Justin Johnson
Residential development in fire-prone wildlands is occurring at an unprecedented rate. Community-based evacuation planning in many areas is an emerging need. The focus of this project is developing a method for using microscopic traffic simulation to generate and test neighborhood evacuation plans in the urban-wildland interface. The method allows an analyst to map the sub-neighborhood variation in household evacuation travel-times under various scenarios. A custom scenario-generator manages household trip-generation, departure timing, and destination choice. Traffic simulation, route choice, and dynamic visualization are handled by a commercial system. A case study is presented for a controversial fire-prone canyon community east of Salt Lake City, Utah. GIS was used to map the spatial effects of a proposed second access road on household evacuation times. The results indicate that the second road will reduce some household travel-times much more than others, but all evacuation travel-times will become more consistent.
Publications: Cova, T.J., and Johnson, J.P. (2002) Microsimulation of neighborhood evacuations in the urban-wildland interface. Environment and Planning A, 34(12): 2211-2229
Wildland Urban Interface Evacuation Model (WUIVAC)
Tom Cova, Phil Dennison, Jeremy Larsen
The wildland urban interface (WUI) is the zone where wildland fuels and human settlement meet. Protective actions, such as evacuation or shelter-in-place, may be required to keep WUI residents safe. WUIVAC is model designed to guide protective active decision making. WUIVAC models "protective action trigger buffers" based on fire rate of spread. When one of these trigger buffers is crossed by the fire, the minimum travel time required for the fire to reach a protected area has been exceeded. A protective action, such as evacuation, should be ordered once the trigger buffer is crossed. WUIVAC trigger buffers can be modeled for strategic scenarios months or years before an actual wildfire threatens.
Publications: Dennison, P.E., T.J. Cova, and M.A. Moritz, 2007. WUIVAC: A wildland urban interface evacuation model applied in strategic wildfire scenarios. Natural Hazards, in press. Abstract Preprint
Cova, T.J., P.E. Dennison, T.H. Kim and M.A. Moritz, 2005. Setting wildfire evacuation trigger points using fire spread modeling and GIS. Transactions in GIS, 9, 603-617. Article

Hyperspectral Retrieval of Fire Temperature
Phil Dennison
Temperature retrieval for wildfires typically uses thermal infrared wavelengths, while fuels mapping typically uses visible and near infrared wavelengths. Hyperspectral data span the visible, near infrared, and shortwave infrared, and contain information on both fuel type and fire temperature. The emitted radiance from the fire can be separated from the reflected solar radiance using spectral mixture modeling. The emitted radiance component can be modeled to determine the dominant temperature of the fire and the fractional area of the pixel radiating at that temperature. The reflected solar radiance can be used to map spatial variation in fuels, and the absence of fuels where the fire has already burned. Shortwave infrared wavelengths allow effective penetration of smoke.
Publications: Dennison, P.E., 2006. Fire detection in imaging spectrometer data using atmospheric carbon dioxide absorption. International Journal of Remote Sensing, 27, 3049-3055. Abstract
Dennison, P.E., K. Charoensiri, D.A. Roberts, S.H. Peterson, and R.O. Green, 2006. Wildfire temperature and land cover modeling using hyperspectral data. Remote Sensing of Environment, 100, 212-222. Abstract Preprint